Benchmarking is a valuable tool in decision-making and ensuring value for money. This step-by-step guide from Caroline Collins shows how the benchmarking process works
If you're responsible for financial management, benchmarking is a valuable tool in your armoury. It will help you make decisions, prepare business plans and be confident that your school, organisation or trust is achieving good value for money.
This resource is designed to help school business and finance managers work through the stages of benchmarking and presenting to senior leaders and governors.
What is benchmarking and why is it important?
Benchmarking is a tool used to compare income and expenditure against similar sized organisations. In schools it is used to look at where savings can be made or to prepare a business case. By having access to data from schools of a similar size and context, staff members responsible for financial management can identify areas of overspend and investigate potential reasons.
Schools are expected to achieve value for money and comparing their spend to other schools helps facilitate this.
What skills are needed to do financial benchmarking?
To carry out a benchmarking exercise, all you need is:
-
an understanding of what you want to find out
-
access to websites
-
some knowledge of Excel
-
an ability to interrogate data
-
communication skills.
Where does the data come from?
Benchmarking data is available from the schools financial benchmarking website. The published data comes from schools' consistent financial reporting (CFR) returns and is updated annually, usually late autumn to early spring. It should be available in time for governors’ spring meetings.
How to carry out the benchmarking exercise
1. Select your data
Once the data is available on the website, the person responsible for the task (usually the SBM or finance manager) can retrieve data based on specific criteria. The website uses a wizard facility to make it easy for you to navigate through.
You can choose between:
-
quick comparison, where the website uses your school’s characteristics to find similar schools (statistical neighbours), or
-
advanced comparison, where you can select your own characteristics.
Quick comparison is the simplest and captures schools that have a similar context to your own. This is the option usually used to get an accurate benchmarking set because it includes important contextual data such as the number of FSM and SEN pupils. If you try to benchmark using the advanced comparison this type of data can get overlooked.
You can choose the number of schools you want to compare with, as well as the type of school. The default number of schools is 15.
The final stage of the wizard allows you to choose which characteristics you want to base your benchmarking on. Unchecking the default boxes would result in the data not being an accurate benchmarking set.
2. Review the results
On completing the wizard the website produces a number of bar charts showing the chosen schools’ data, giving a clear picture of where your school is in the set.
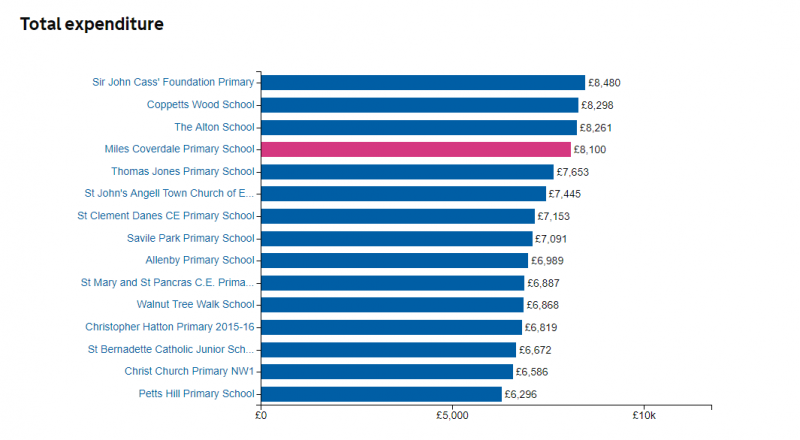
The first set of results shows the total expenditure. Each school in the graph has a hyperlink which leads to more detailed financial information and graphs. At this point you can do more investigations on a particular area of spend if you need to.
The drop-down menu at the top of the screen leads you to specific areas of spend. You can also change the values so rather than looking at spend per pupil, you could choose spend per teacher.
A useful option that you can select from the drop down is percentage of total. When you are reporting to governors it is always good to refer to the percentage of total as it tends to carry more meaning.
How this helps: a scenario
How much do you spend on energy costs? Is it a reasonable amount? By comparing it to your statistical neighbours you might be surprised with the results.
To look at this you would choose occupation from the drop down box and scroll down the page to see the comparison.
If you find that your spend is higher than expected, try contacting some of the other schools and asking some further questions, such as the ones below. Keep a note of any responses for your report.
-
What supplier do you use?
-
What tariff are you on?
-
Do you have LED lighting?
-
Have you done anything to reduce costs?
The same approach applies to other areas. For example, you want to employ an additional member of staff, but the governors have questioned a potential overspend. You could use benchmarking data to demonstrate that you're not overspending in comparison to other schools, as part of a business case for the governors.
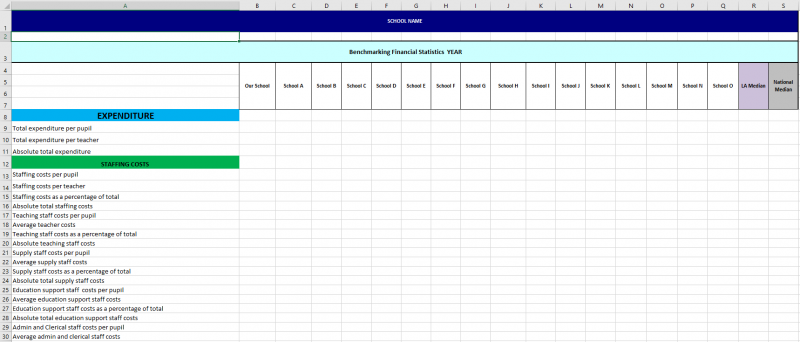
3. Transpose the data
The website offers you a CSV download so all the data will go into a spreadsheet, but it’s a difficult document to use. Instead, prepare a template which has the various characteristics and comparison columns for you to transpose the data into.
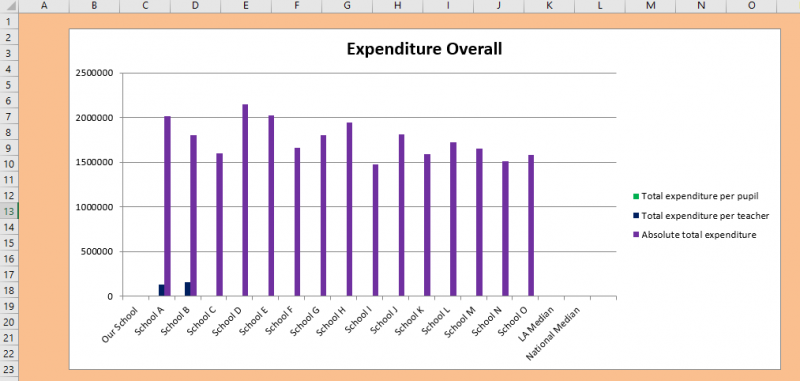
One sheet in the workbook would contain the bar charts, which will automatically update as data is entered.
You could also include a comments or action worksheet to record your findings and the outcome of any investigations.
4. Look at trends in your own school
To look at trends across specific periods in your own school, go back to the website data set and click on the relevant link. The benchmarking data for your school will show line graphs for the past five years.
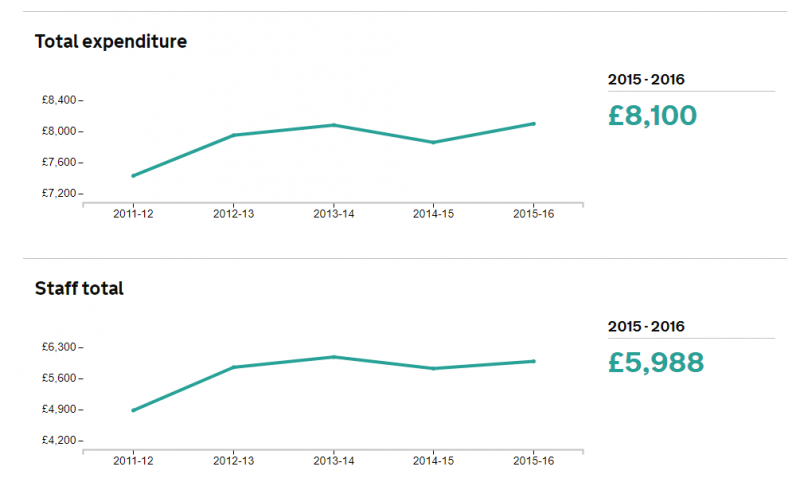
Hover over the line graph for each year to show the total. To save this, either enter the data into a new worksheet to create the same line graph, or copy and paste the line graph as an image.
Benchmarking pitfalls
-
Don’t take the numbers at face value. For example, if comparing average staff salary cost with other schools, it’s worth comparing pupil progress measures too. Be ready to ask more questions.
-
Beware only seeing what you want to see. Don’t just look for data or information that backs up your existing belief or desired outcome. Be aware of your cognitive bias.
-
Make sure you have enough information. Verify your data by using different sources or looking at different aspects of a situation.
(Tips from Stephen Mitchell, Chief Operating Officer of The Spencer Academies Trust, shared at the 2018 MATs Summit)
5. Report the findings
Once the data is in place, the charts are populated and investigations have been conducted and logged, prepare your report.
Set up a report template. You can use and adapt the model provided here.
The report should include:
-
charts and graphs with commentary
-
contextual as well as financial data.
Don't just show total spend. Drill down into the relevant areas using data from the benchmarking website. For example, rather than giving a staffing costs as one figure, break down the different aspects. E.g.
Staffing costs to include:
-
total cost of staffing
-
percentage of budget
-
cost of teaching staff
-
cost of supply staff
-
cost of admin staff
-
cost of premises staff
-
cost of other staff.
Ensure that you include information about investigations you have conducted, and conclude the report with a summary of findings.
Try to pre-empt questions that staff and governors might raise so that you can answer them immediately.
The report should be presented to the senior leadership team and governors. Ensure you are familiar with the benchmarking data and findings so that you can answer any questions that might come your way.
Top tips
-
Prepare your spreadsheet and report in advance.
-
Take time to scrutinise the data.
-
Pick up the phone and speak to the schools that you want to question.
-
Be honest in your report.
-
Have as much information as possible to present the information.
-
Make use of visual aids such as graphs and charts.
-
Be thorough but keep it simple.
And remember: benchmarking shouldn’t be a chore. If you have the spreadsheet and report template in place you’re halfway there.


